
The latest social housing satisfaction figures are out.
The good news is that social housing landlords are getting better at repairs and responding to complaints. But are residents actually happier?
On 5 November 2026, the Regulator of Social Housing published its latest Tenant Satisfaction Measures (TSMs), providing an overview of how social housing landlords in England are performing and how residents feel about the services they receive.
At Experience Makers, we've been looking through the results to understand what's improving, where significant differences remain and what the findings tell us about customer experience in real estate. You can read the full briefing document here.
Here are seven findings worth paying attention to.
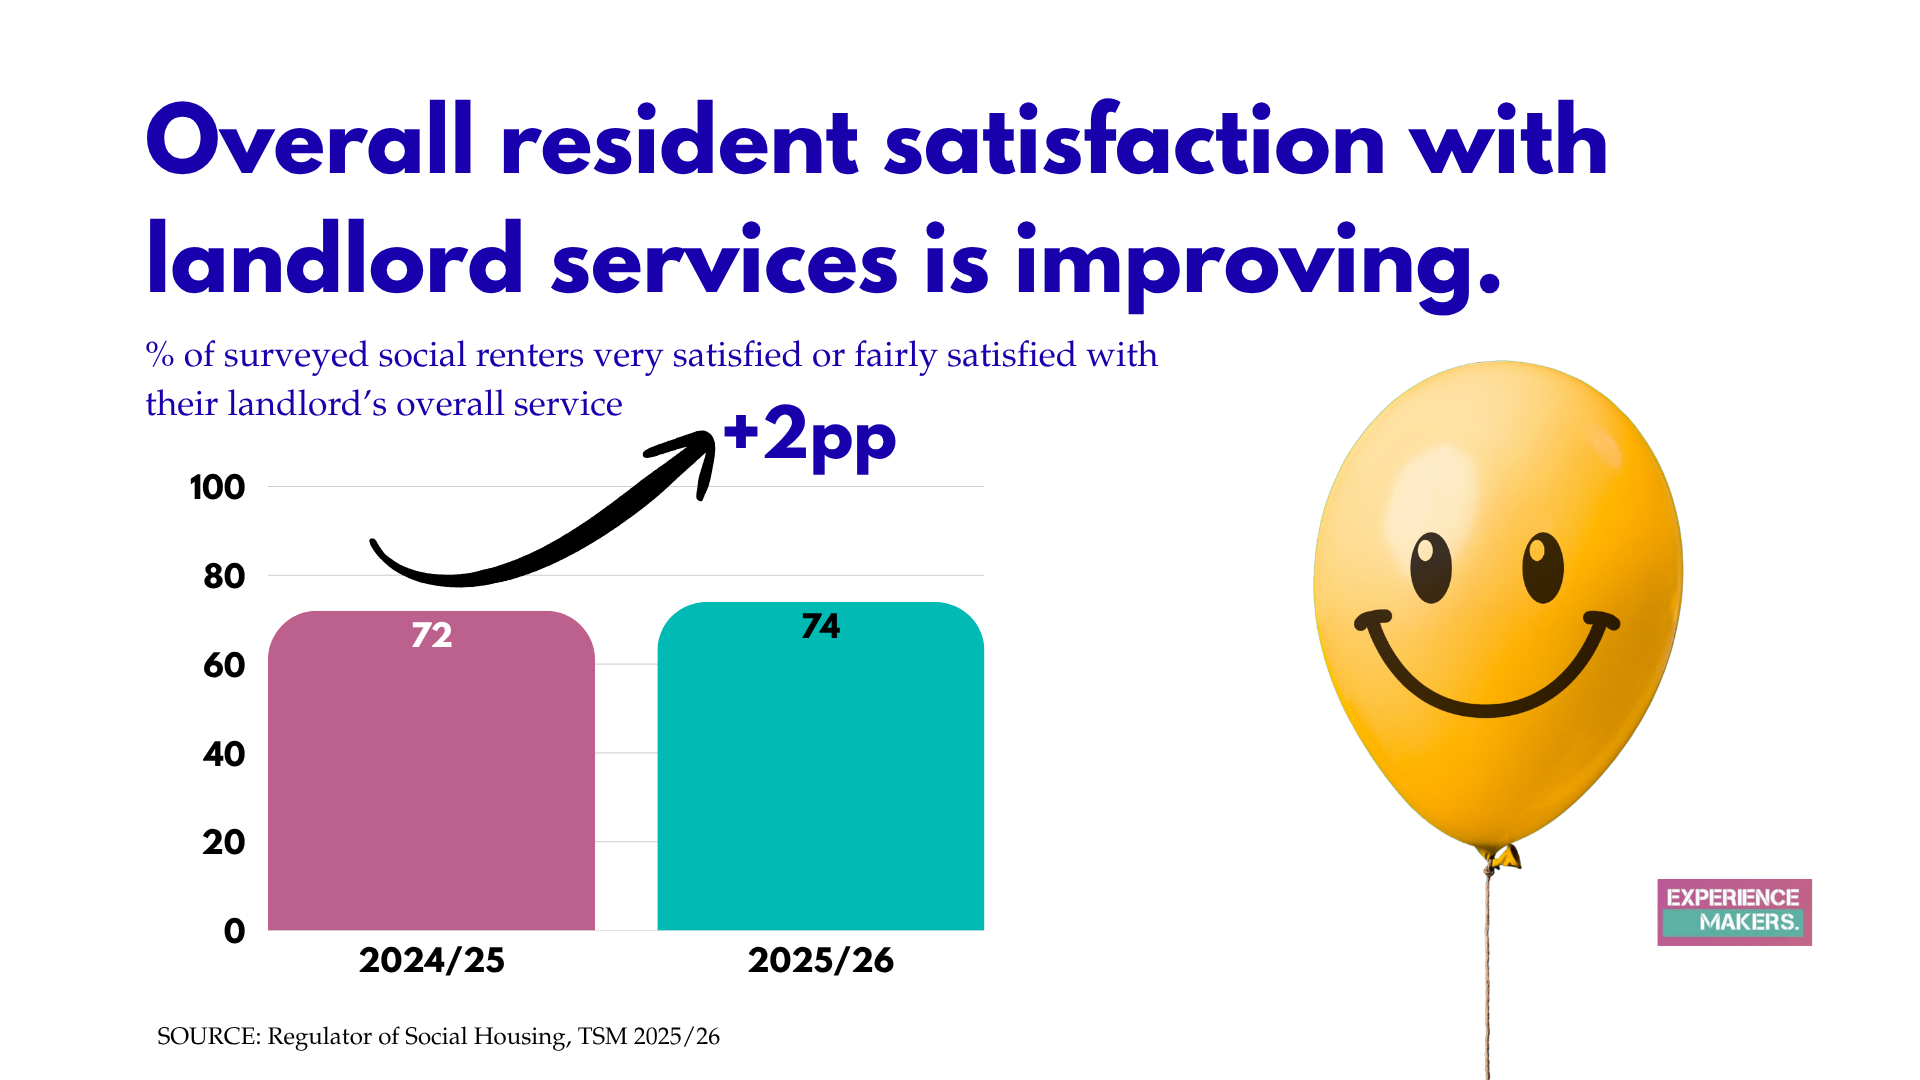
1. Overall resident satisfaction is improving
Overall satisfaction with landlord services increased from 72% in 2024/25 to 74% in 2025/26, a two-percentage-point improvement.
This measures the proportion of surveyed social renters who said they were very or fairly satisfied with the overall service provided by their landlord.
It's an encouraging result, suggesting that residents' experiences are improving across the sector.
However, the headline figure conceals some substantial differences between landlords and regions.
2. Smaller landlords have happier residents
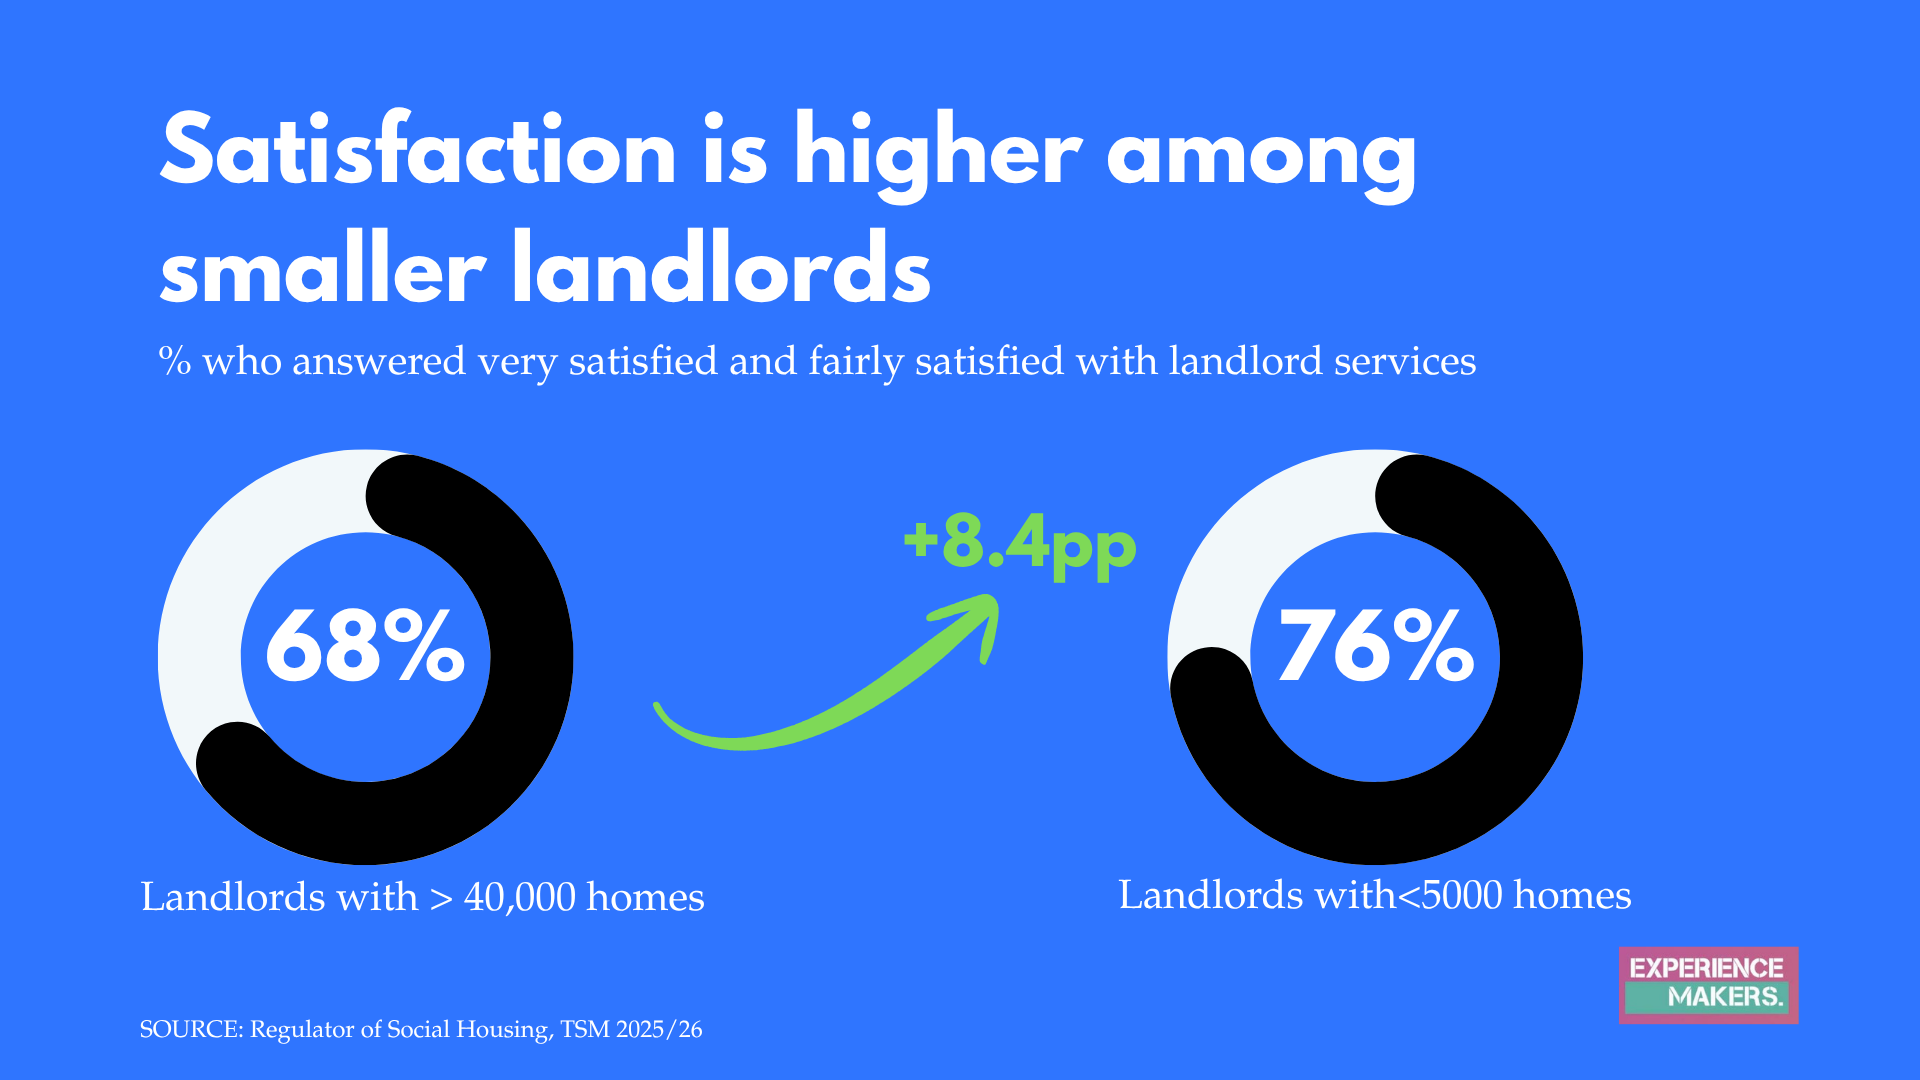
Satisfaction is higher among smaller social housing landlords.
Landlords with fewer than 5,000 homes reported satisfaction of approximately 76%, compared with 68% among landlords with more than 40,000 homes.
That's an 8.4-percentage-point difference.
The results raise an interesting question about scale and customer relationships.
Do smaller organisations find it easier to deliver personal, responsive services? And how can larger landlords maintain those qualities while managing much bigger portfolios?
Of course, landlord size isn't necessarily the cause of the difference. Geography, property characteristics and other factors may also influence satisfaction.
Nevertheless, it's a comparison worth exploring.
3. Where you live makes a difference
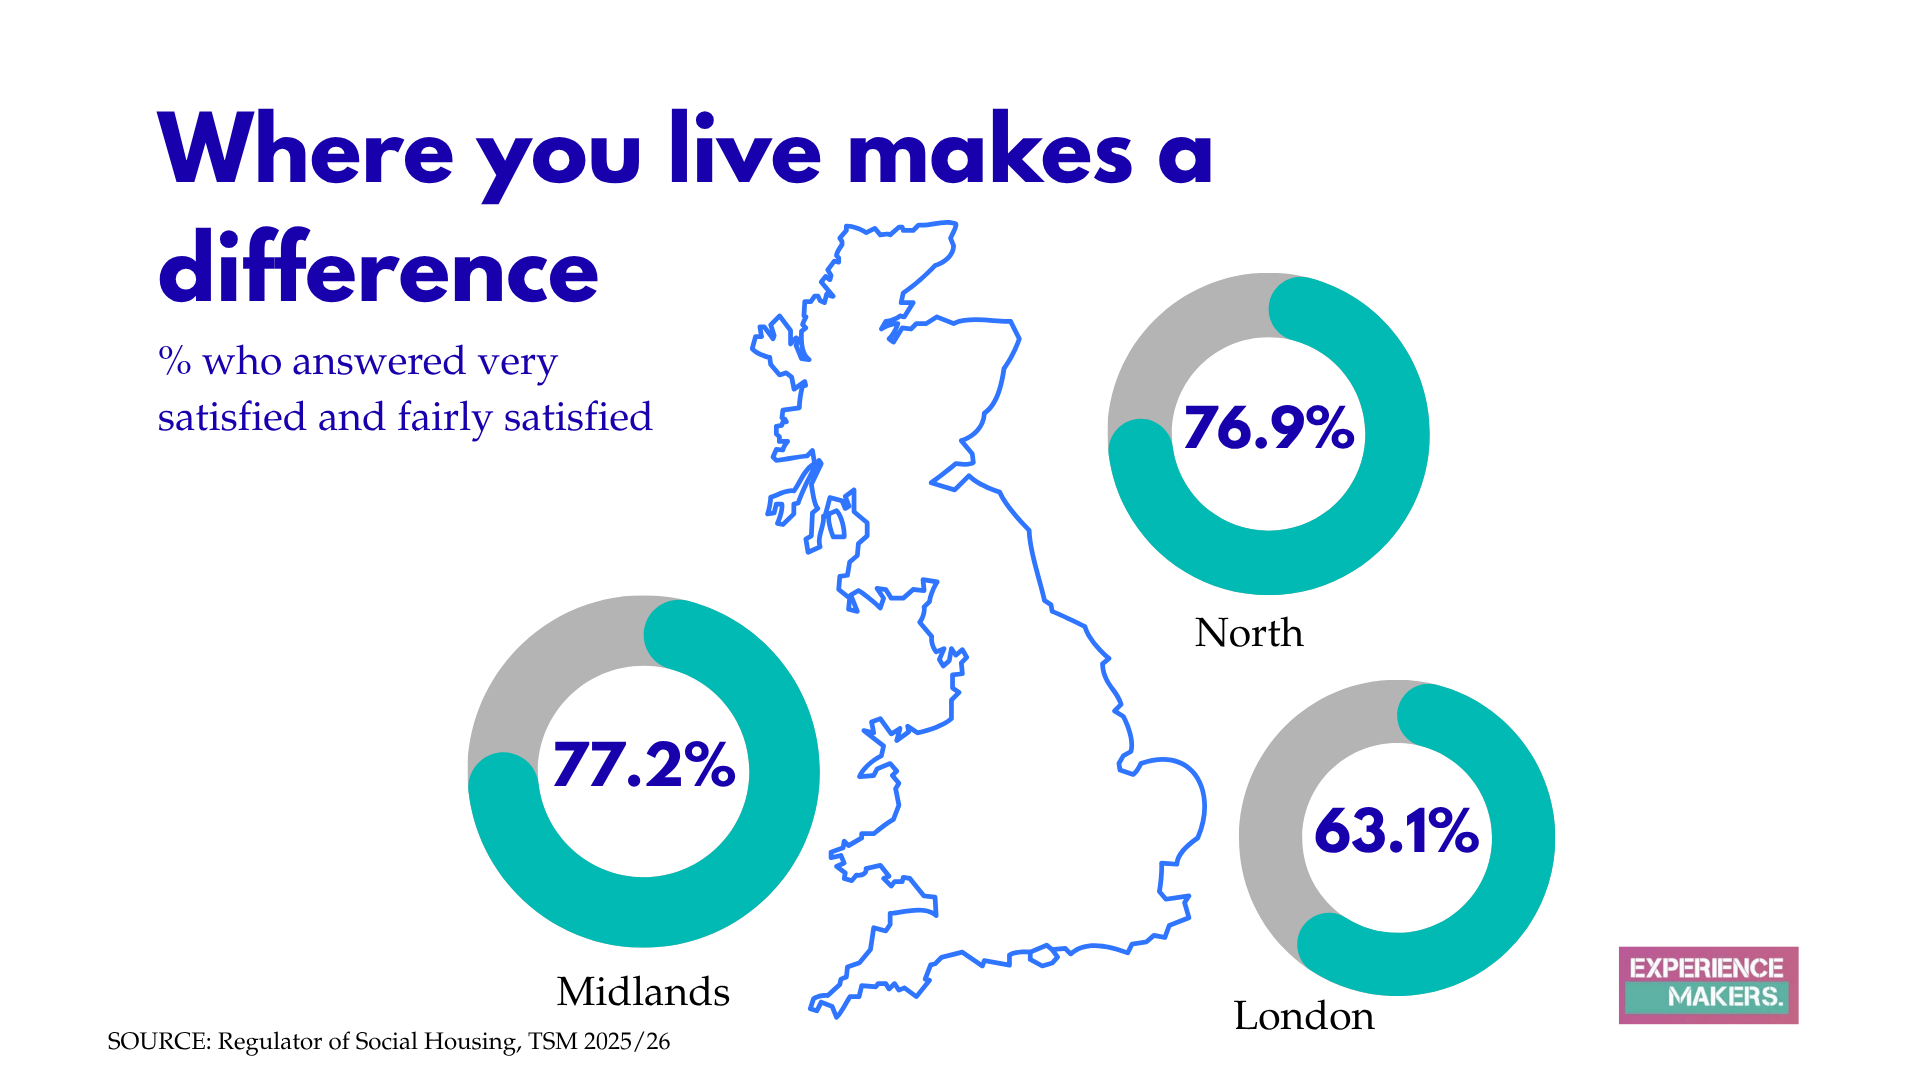
There are also significant regional differences in satisfaction with landlord services.
Midlands: 77.2%
North: 76.9%
London: 63.1%
That's a 14.1-percentage-point gap between the Midlands and London.
These differences may reflect a combination of factors, including housing stock, local operating conditions, customer expectations and landlord characteristics.
For property managers, the implication is that national averages don't tell the whole story. Understanding performance within the context of a particular portfolio, region or customer group is essential.
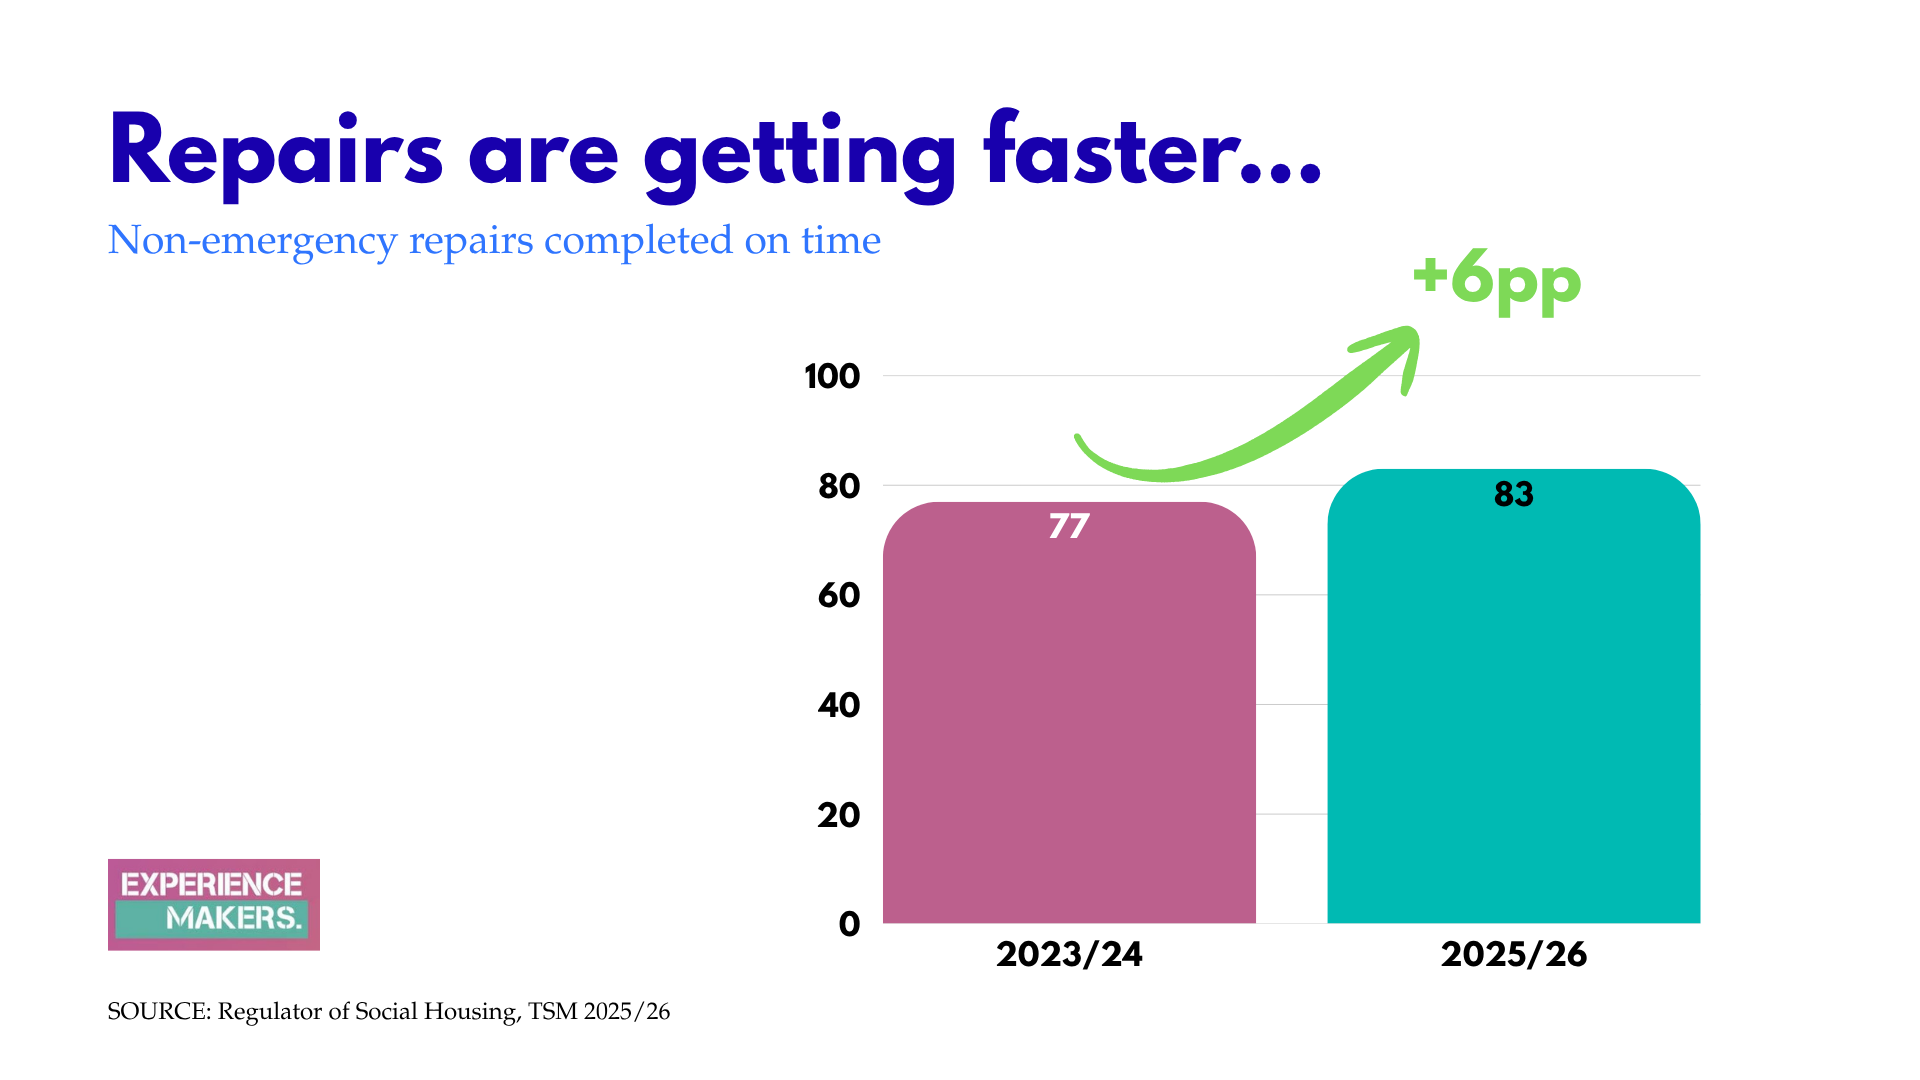
4. Repairs are getting faster, and residents are noticing
One of the most encouraging findings is the improvement in repairs performance.
The proportion of non-emergency repairs completed within landlords' target timescales increased from 77% in 2023/24 to 83% in 2025/26.
Importantly, residents' reported experiences have improved alongside this operational performance.
Over the same period:
Satisfaction with the timeliness of repairs increased from 67% to 73%.
Satisfaction with home maintenance increased from 71% to 74%.
This is a useful example of operational improvements being accompanied by improvements in customer satisfaction.
Completing repairs on time is important, but so is understanding whether residents are satisfied with the service they receive.
In this case, both sets of measures are moving in the right direction.
5. Complaint handling remains a major challenge
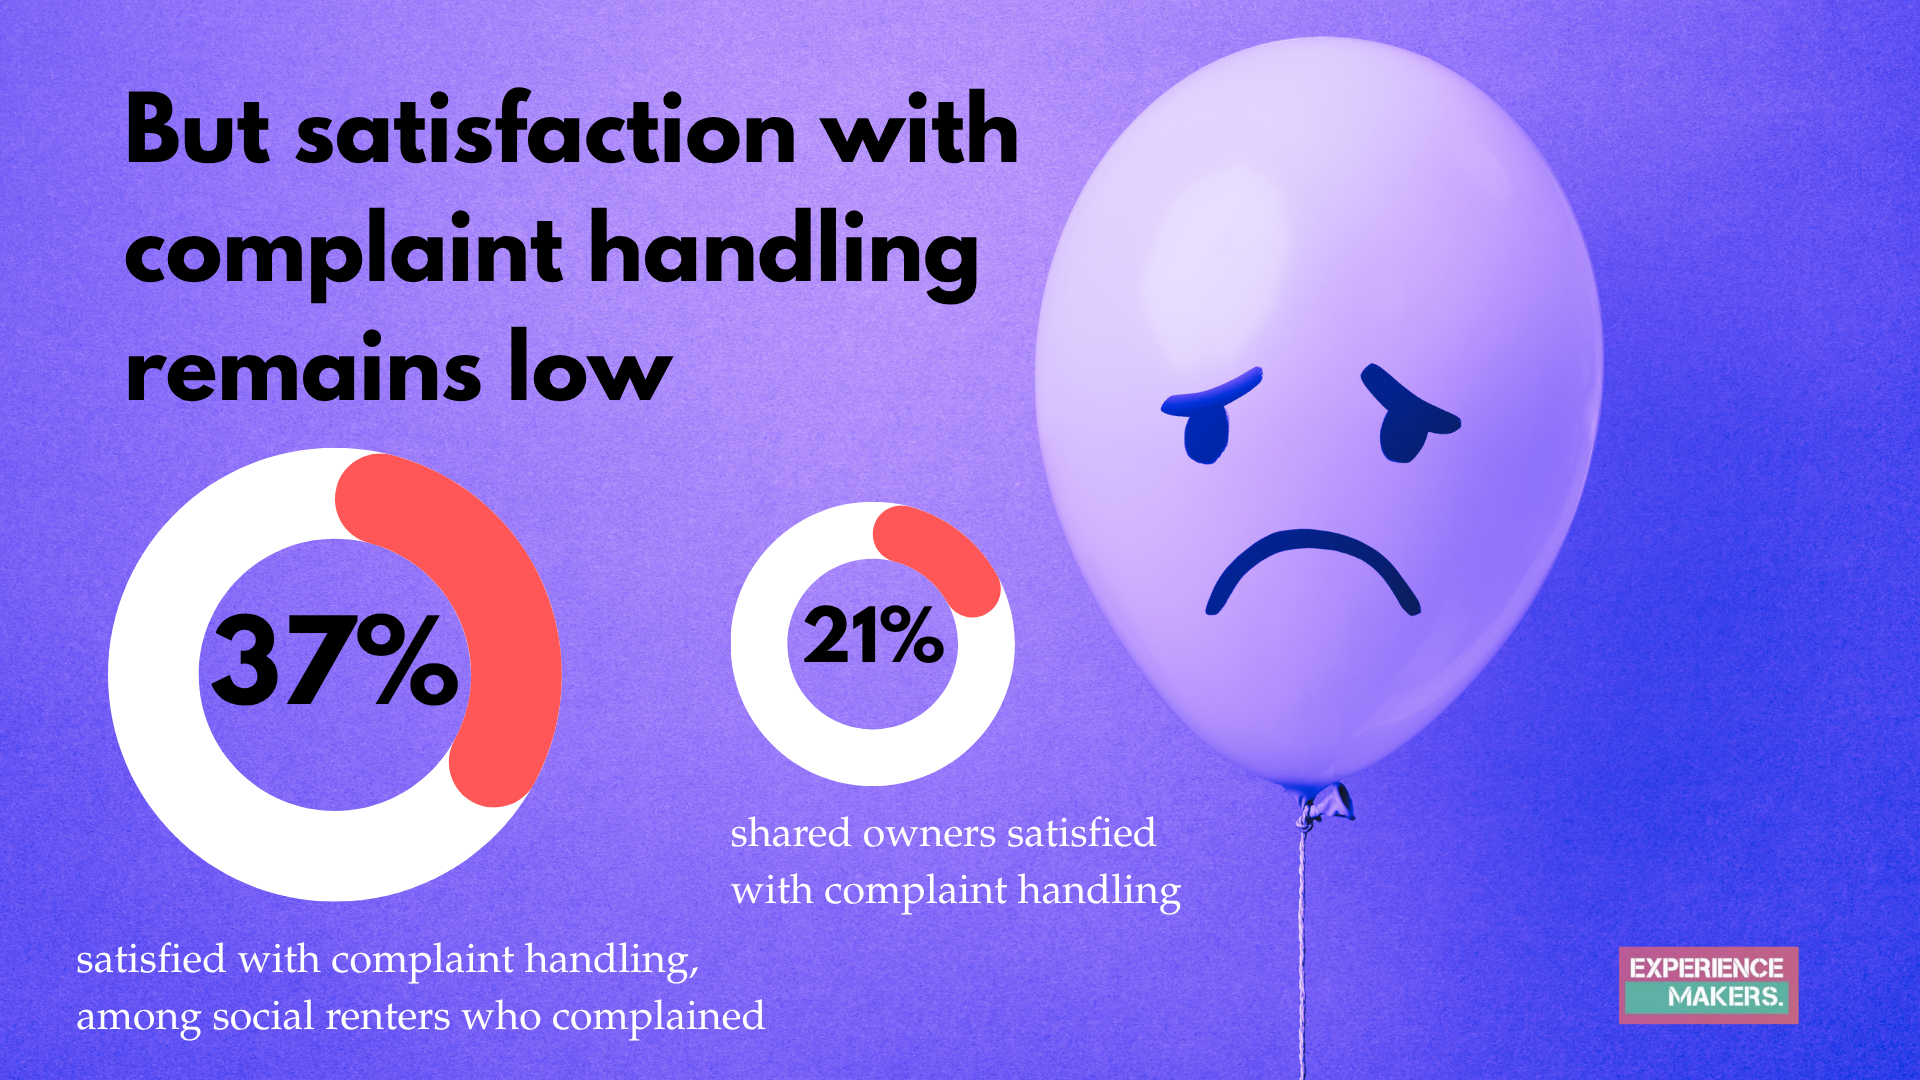
Despite improvements elsewhere, satisfaction with complaint handling remains particularly low.
In 2025/26, just 37.4% of social renters who reported making a complaint were satisfied with how their landlord handled it.
Among shared owners, the equivalent figure was even lower, at 21.4%.
Complaints are often among the most important interactions between a customer and a service provider. They provide an opportunity to resolve problems, rebuild confidence and demonstrate accountability.
Low satisfaction with complaint handling therefore deserves particular attention.
It isn't enough to know that a complaint has been processed. Landlords also need to understand whether residents feel listened to, whether the outcome was satisfactory and how the experience affected their relationship with the organisation.
6. Complaints are being answered on time more often
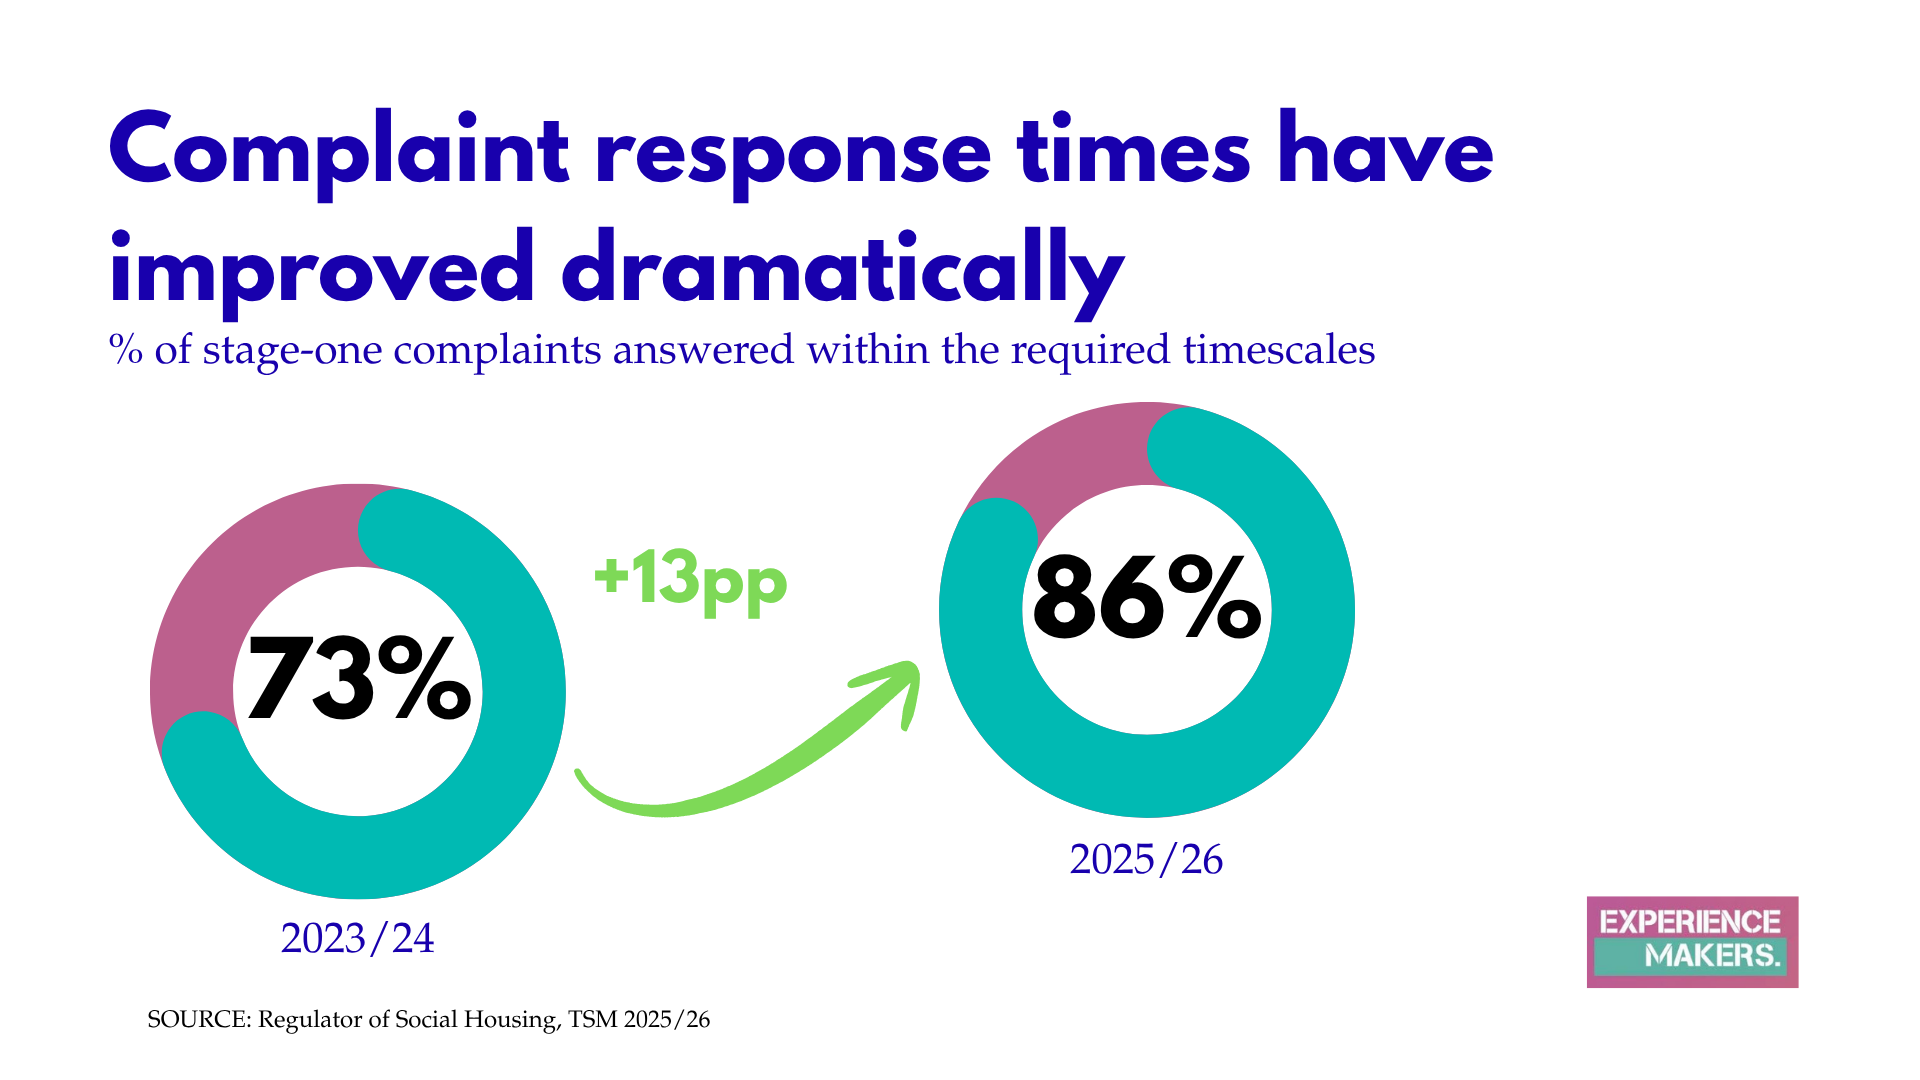
There has been substantial progress in the proportion of complaints answered within the required timescales.
In 2023/24, 73% of stage-one complaints were answered on time.
By 2025/26, that figure had increased to 86%.
That's a 13-percentage-point improvement.
However, when considered alongside the low satisfaction with complaint handling, it raises an important question.
Are we measuring how efficiently complaints are processed, or how effectively customers' problems are resolved?
These are different measures, based on different populations and methodologies, so the percentages shouldn't be directly compared. Nevertheless, they illustrate why operational KPIs and customer experience measures need to be considered together.
A complaint can be answered within the required deadline without the customer necessarily being satisfied with the response.
7. Recorded complaints are rising
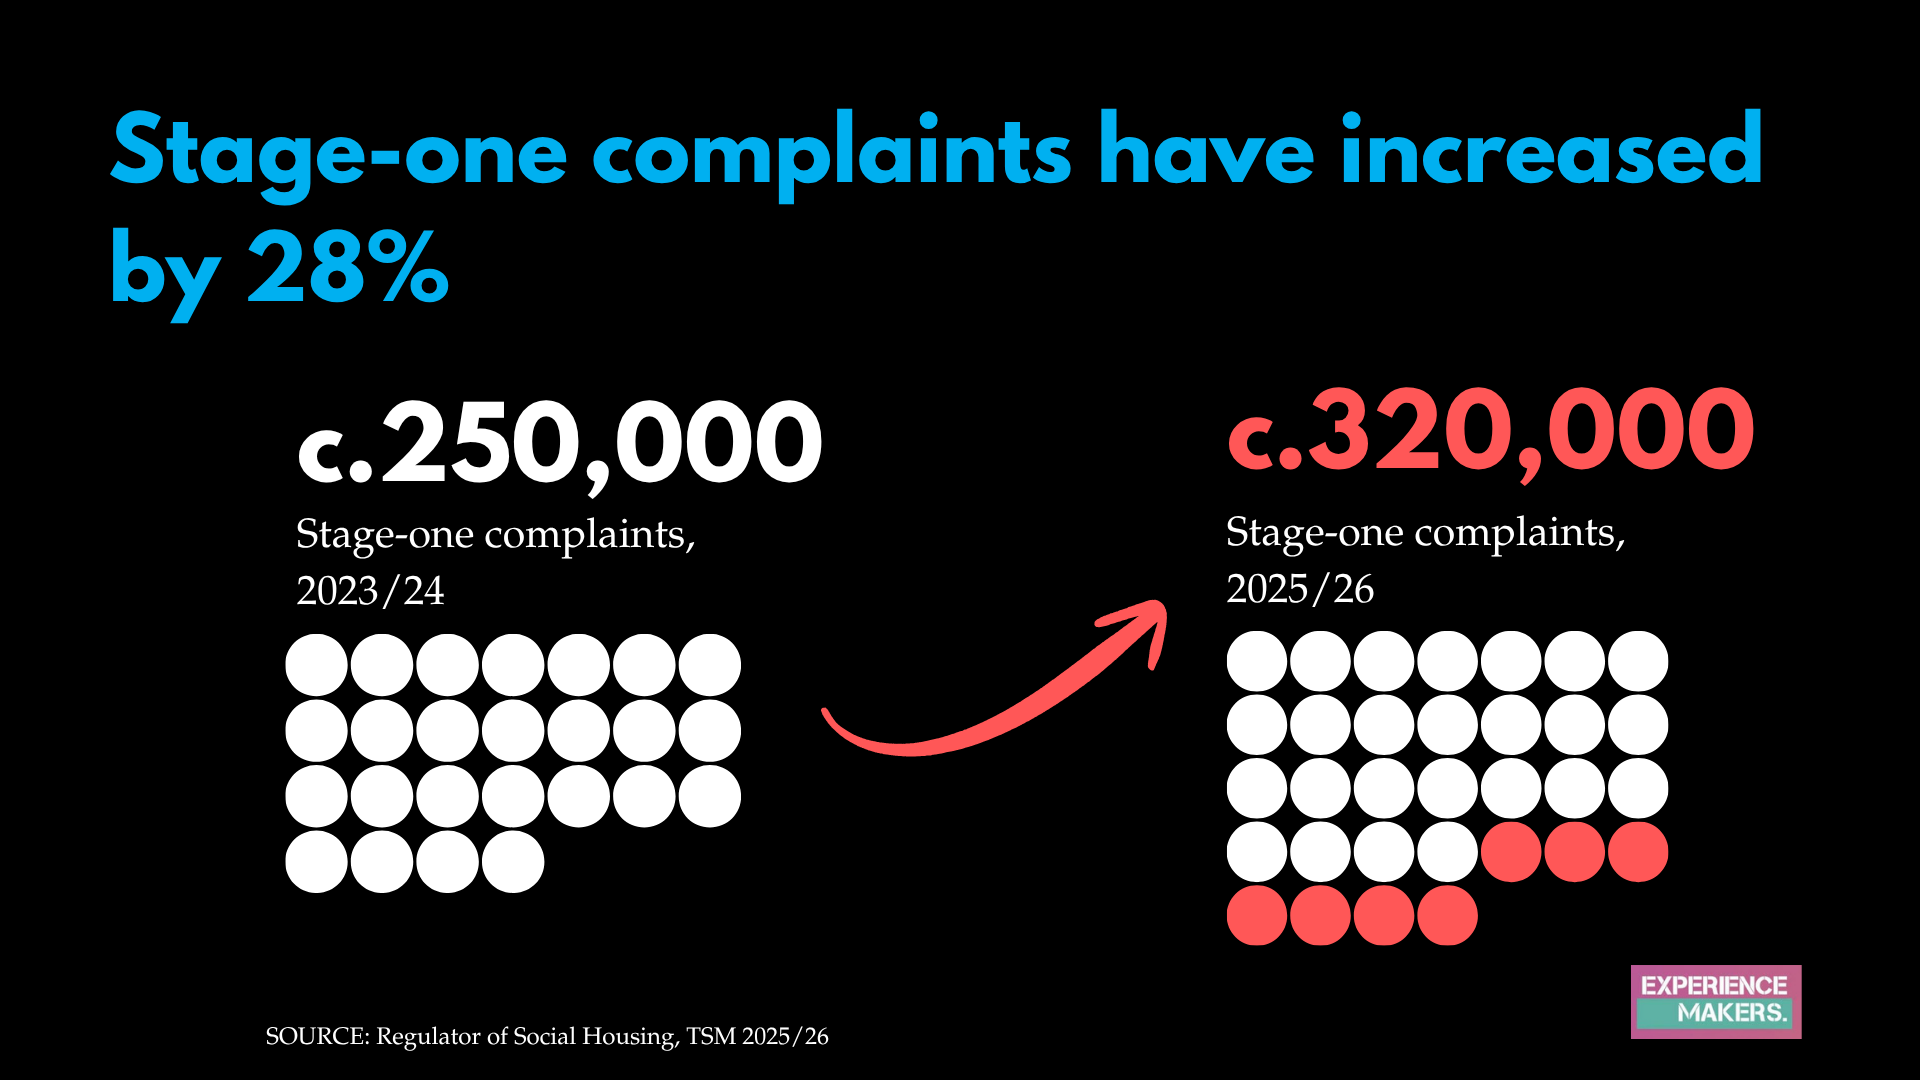
The volume of recorded complaints has also increased significantly.
Between 2023/24 and 2025/26:
Stage-one complaints increased from approximately 250,000 to 320,000, an increase of around 28%.
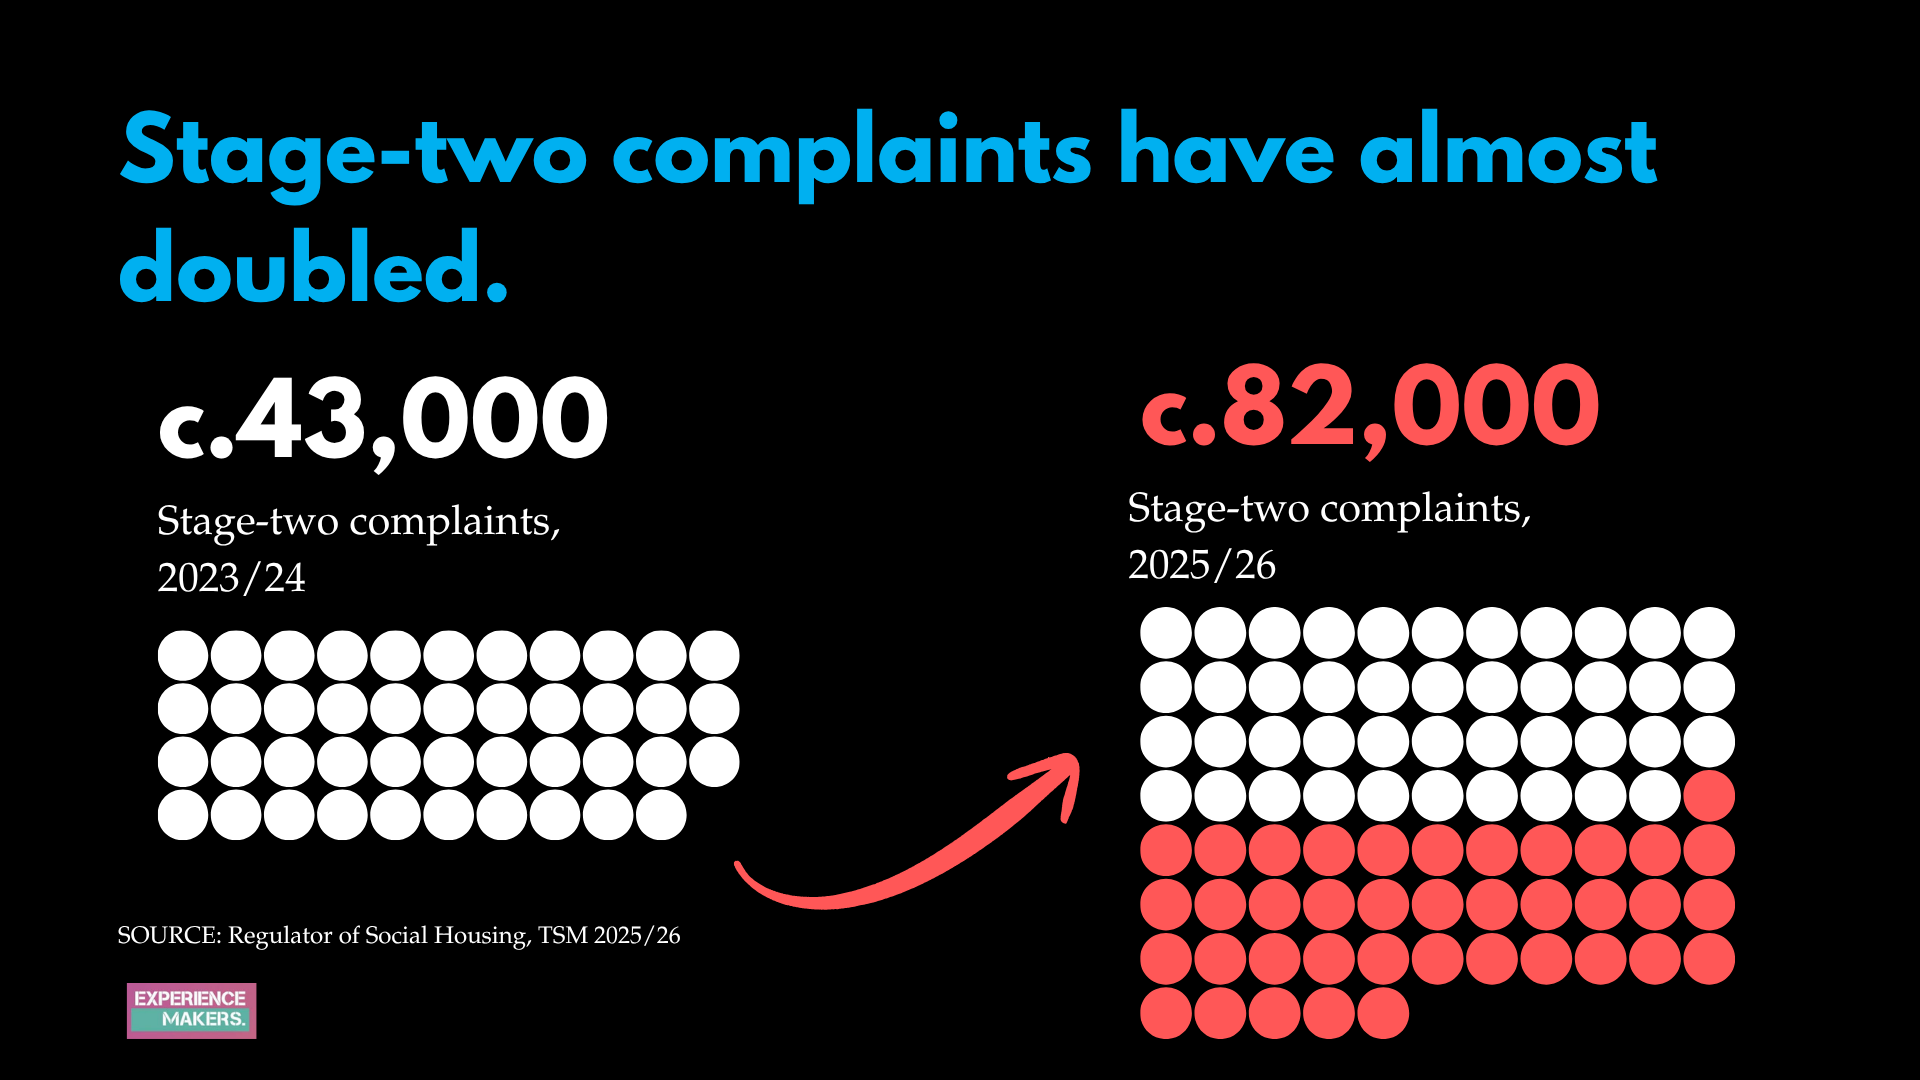
Stage-two complaints increased from approximately 43,000 to 82,000, almost doubling.
These figures deserve attention, but they don't necessarily mean that service quality has deteriorated.
Changes in complaint definitions, reporting and recording practices may contribute to the increase.
There's another interesting distinction in the data.
Around 25% of surveyed social renters said they had made a complaint, while landlords' administrative records showed approximately 7.2 complaints per 100 homes.
These aren't directly comparable measures, but they highlight how customers and organisations may define complaints differently.
A resident may feel they have complained about a problem even when the landlord has recorded the interaction as a service request.
For anyone responsible for customer insight, that's an important reminder that internal records don't necessarily capture the full customer experience.
What can we learn from the 2025/26 Tenant Satisfaction Measures?
There are five conclusions we think property managers should take from the results.
1. Overall satisfaction is improving, but significant gaps remain. Satisfaction varies considerably by region and landlord size, suggesting that residents aren't experiencing the same levels of satisfaction across the sector.
2. Better operational performance can translate into better customer experiences. Repairs are being completed on time more frequently, and satisfaction with repair timeliness and home maintenance is also improving.
3. Complaint handling remains a major challenge. More complaints are being answered within the required timescales, but satisfaction with how complaints are handled remains low.
4. Rising complaint volumes deserve closer examination. Recorded complaints have increased significantly, although changes in reporting practices may explain some of the increase.
5. The numbers tell us what is happening, but not necessarily why. Understanding the experiences behind the statistics is essential to identifying what needs to improve.
These lessons aren't limited to social housing. The same questions apply to commercial landlords, managing agents and other property organisations seeking to understand and improve customer experience.
Continue the conversation with Experience Makers
Improving customer experience requires organisations to share ideas, learn from one another and continually challenge what good looks like.
The Experience Makers Best Practice Group brings together real estate professionals to discuss common challenges, share insight and learn from peers across the industry.
If you're interested in contributing to the conversation, visit experiencemakers.com or email info@experiencemakers.com.
And if you're ready to launch your next satisfaction survey, RealService can help. We work with landlords and property managers to design and deliver surveys, benchmark performance and turn customer feedback into actionable insights.
Source and methodology
This article draws on the Regulator of Social Housing's Tenant Satisfaction Measures 2025/26, published on 5 November 2026.
The results combine tenant perception survey measures and landlord-reported management information. Satisfaction figures generally refer to the proportion of respondents who answered “very satisfied” or “fairly satisfied”. The regulator uses different aggregation methods for different measures, including median landlord results and sector-wide figures.
Figures have been rounded for readability. Comparisons between operational performance and tenant perception measures should not be interpreted as comparisons of identical populations.
Original source: Regulator of Social Housing: Tenant Satisfaction Measures 2025/26
Published by Experience Makers | November 2026